In the running community, a long-standing saying is that there is about a 10% gap between men's and women's marathon performances, so a men's 3:00 is roughly equivalent to a women's 3:18, and a men's 4:00 is roughly equivalent to a women's 4:24.
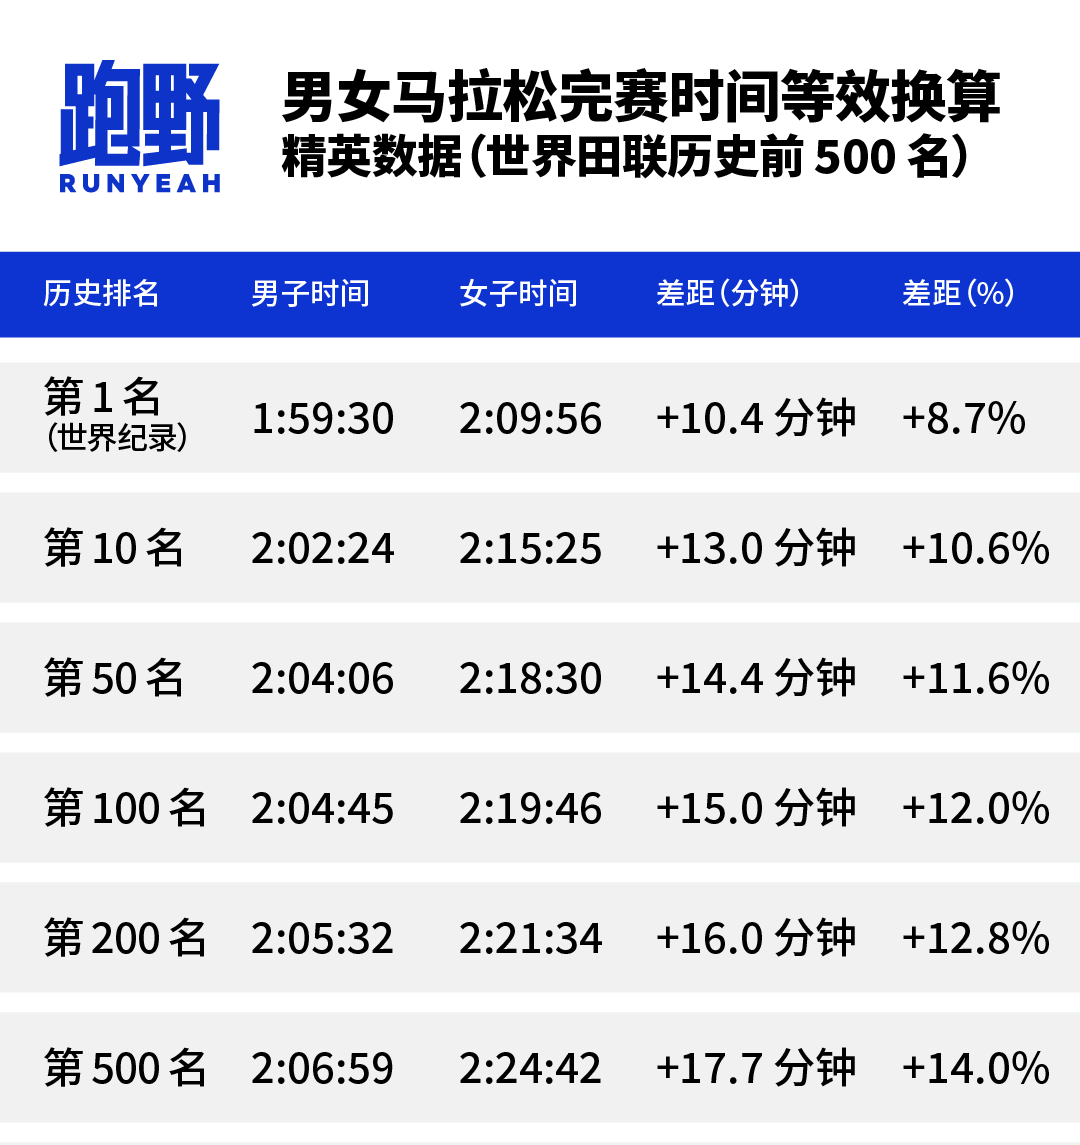
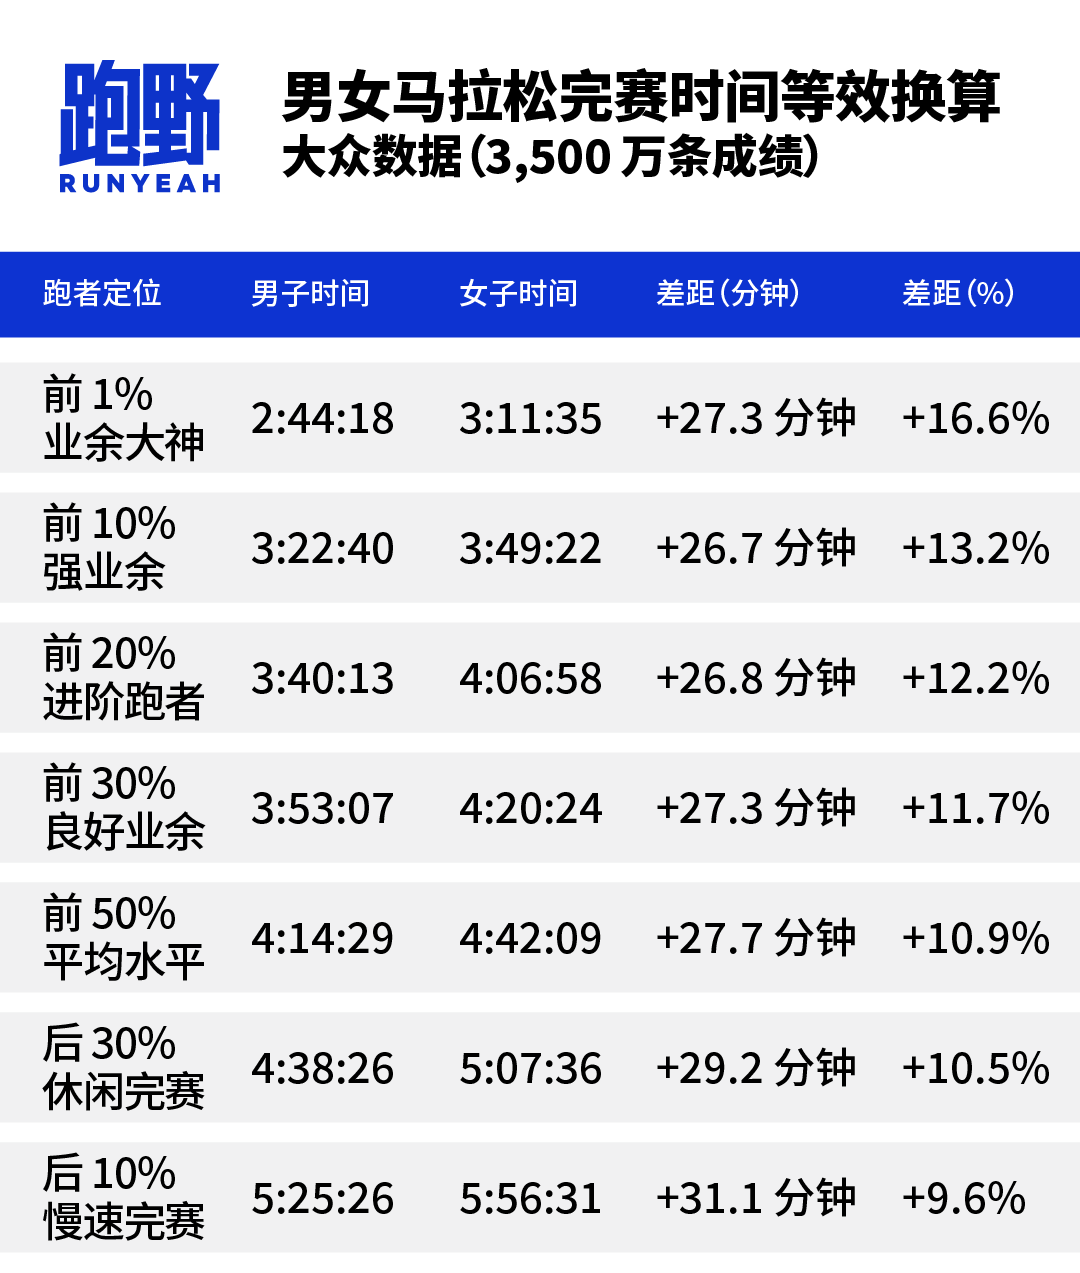
The origin of this claim is the ratio obtained by dividing the women's world record by the men's world record. Before 2024, the men's world record was 2:01:09, the women's 2:11:53, and the ratio was about 8.7%, so many people applied that number to all performances.This method has a fundamental flaw: it uses the ratio of two extreme values to represent the differences for everyone.World records are the limits of human performance under the most ideal conditions, representing the very top of the global running pyramid. An ordinary runner who finishes in 4 hours faces a completely different competitive environment, physiological state, and training background than a world-record holder. Applying the same proportion is like using the Olympic 100m champion’s speed to estimate how long it would take you to run 1 kilometer — the result will inevitably be distorted.Using conversion methods based on a vast amount of real race data, we will provide a complete conversion table accurate to the minute.We believe the fairest standard for judging whether two performances are "equivalent" is: they beat the same proportion of runners within their respective sex groups.If a man finishes in the top 10% of male runners worldwide, his equivalent women's performance is the time that sits in the top 10% of female runners worldwide.If a man's result ranks 50th in world history, his equivalent women's time is the time of the woman who ranks 50th in world history.The core of this principle is equivalence of rarity: how rare you are within your own sex group corresponds to how rare the other is within hers. This method relies on no preset physiological constants and is driven entirely by real race data.Because elite athletes and mass-participation runners exist in completely different competitive ecosystems, we split the data into two layers and use the most authoritative sources for each.Elite data (World Athletics all-time top 500)Data source: World Athletics all-time top 500 marathon rankings; data through April 2026.Calculation method: Match the fastest 500 men and the fastest 500 women historically by rank, and calculate the time difference at each ranking position.Key finding: The gender gap among elites is not a fixed value; it widens as ranking declines, expanding from 8.7% at the world record to 14.0% at the 500th place. This suggests the depth of competition among elite men is currently greater than among women.General runners data (RunRepeat — 35 million results)Data source: RunRepeat's global running results database, covering more than 28,000 races over the past 20 years and 35 million finish records.Conversion method: Extract the finish times for men and women at each percentile (Percentile) and match them by the same percentile. Percentile here means "the proportion of same-sex runners beaten."Key finding: Among recreational runners, as pace slows the gender gap actually narrows (from 16.6% down to 9.6%). This aligns with exercise physiology research: women often have better pace stability and fatigue resistance than men in long-distance endurance events, which is more pronounced among slower finishers.In the comparison table, we label "Top 10%" as approaching the "Boston qualifying threshold." This requires careful explanation.
What are the Boston qualifying standards?
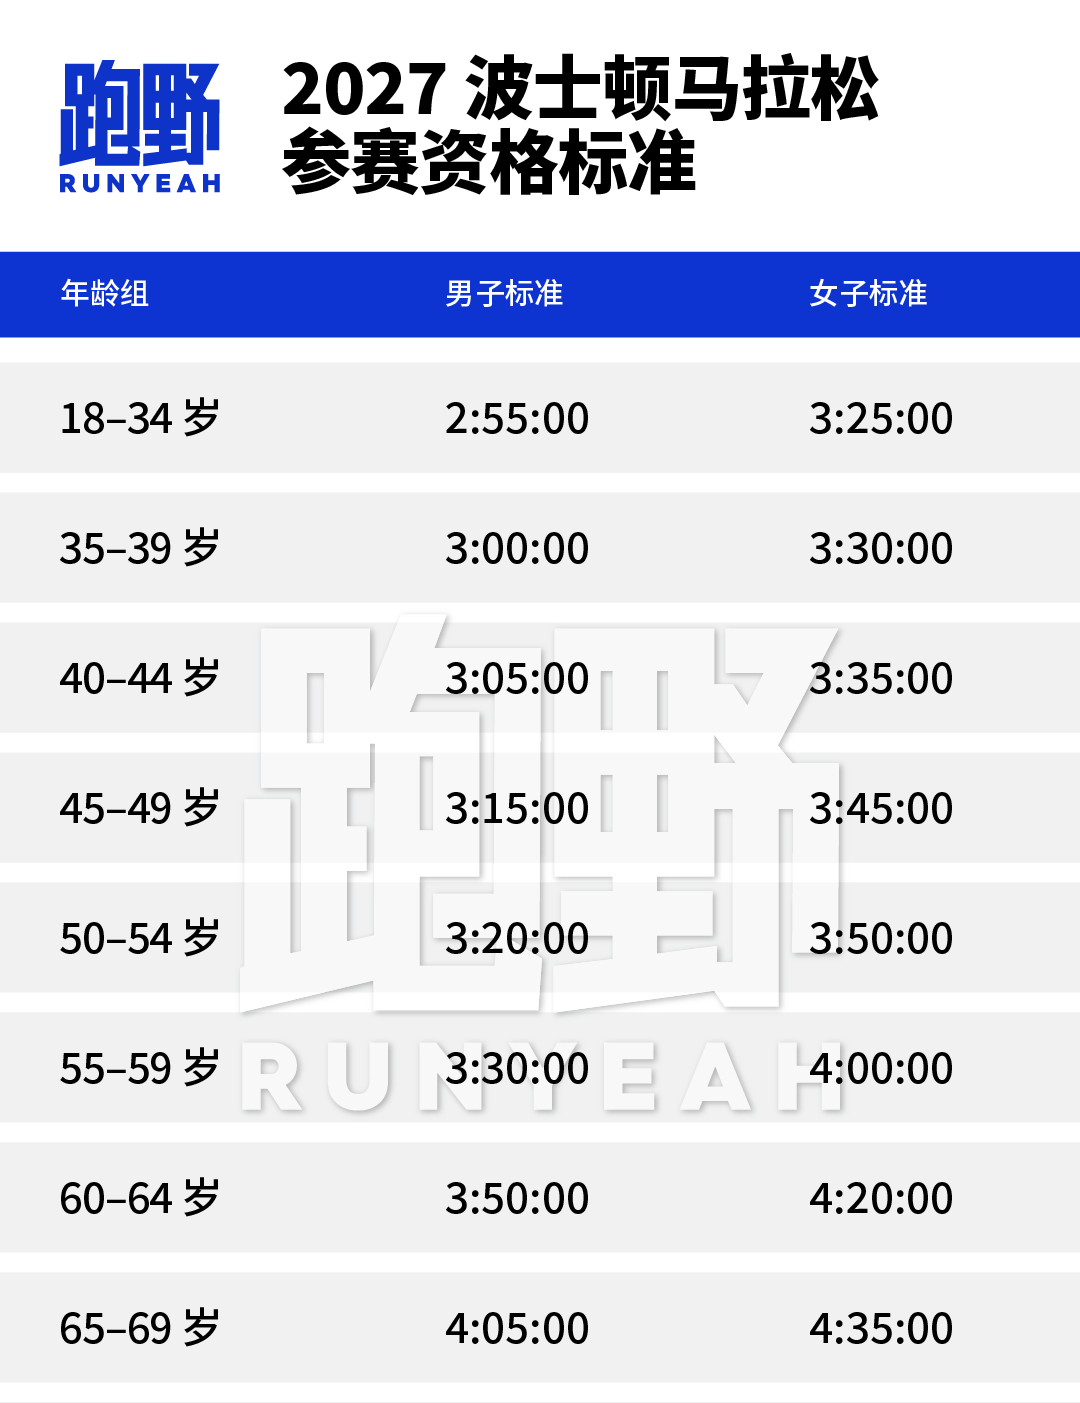
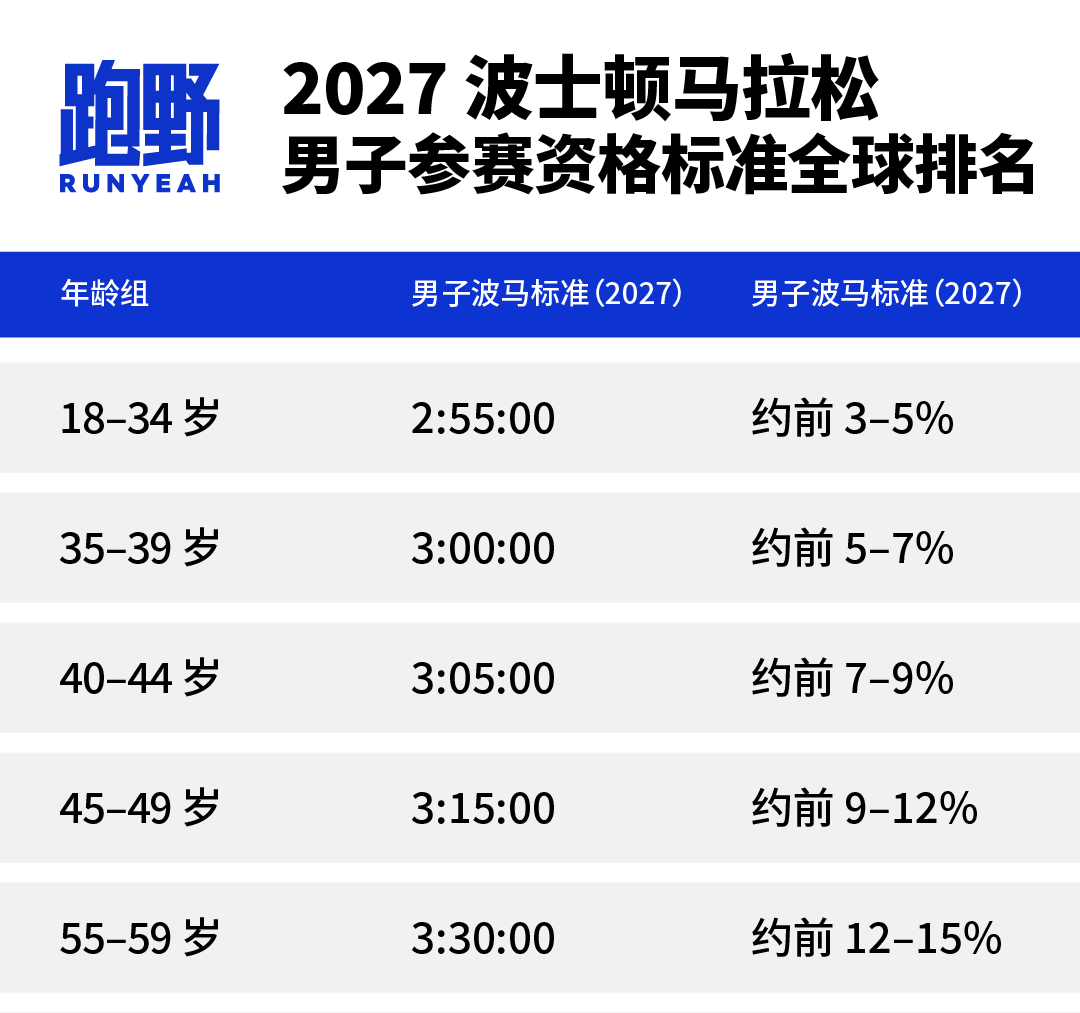
The Boston Marathon is the only World Marathon Majors race that sets a strict finish-time threshold for ordinary entrants. If you don't meet it, you're not eligible to register. The 2027 Boston qualifying standards are as follows:
Important note: meeting the qualifying standard only makes you "eligible to register" and does not guarantee entry. Because registrations routinely exceed available spots, in recent years the actual admission threshold has been 5–7 minutes faster than the standard time (known as the "cutoff"). The 2025 cutoff reached as much as 6 minutes 51 seconds, meaning men aged 18–34 actually needed to run roughly 2:53 to be admitted.
What proportion of runners worldwide can meet the Boston Marathon standard?
According to Outside Magazine's analysis of approximately 564,000 U.S. marathon finishers in the 2025 Boston qualifying window (September 2023 to September 2024):
About 13% of all male finishers met the Boston Marathon qualifying standard, and about 14% of all female finishers met the Boston Marathon qualifying standard.
A peer-reviewed paper from the Colorado School of Mines published in PLoS ONE shows that, the Boston Marathon qualifying rate by age group is about 4%–9%, with an overall average of about 7%–10%.
"Top 10%" and its relationship to Boston qualifying standards
"Top 10%" is a reasonable approximate midpoint, but it varies significantly across age groups:
Conclusion: The Boston Marathon standard for younger runners (18–34) is actually at about the top 3–5% globally, much harder than "top 10%"; for runners over 50 it corresponds to roughly the top 10–15%, relatively lenient. Using "top 10%" in our reference table as a representative label is a reasonable approximation but must be interpreted in the context of age.
With the two solid anchors — "elite ranking data" and "mass-participation percentile data" — we use a linear interpolation algorithm (Linear Interpolation) to seamlessly connect the two datasets, thereby calculating a dynamic conversion coefficient for any finish time (accurate to the minute).The whole conversion process is as follows:
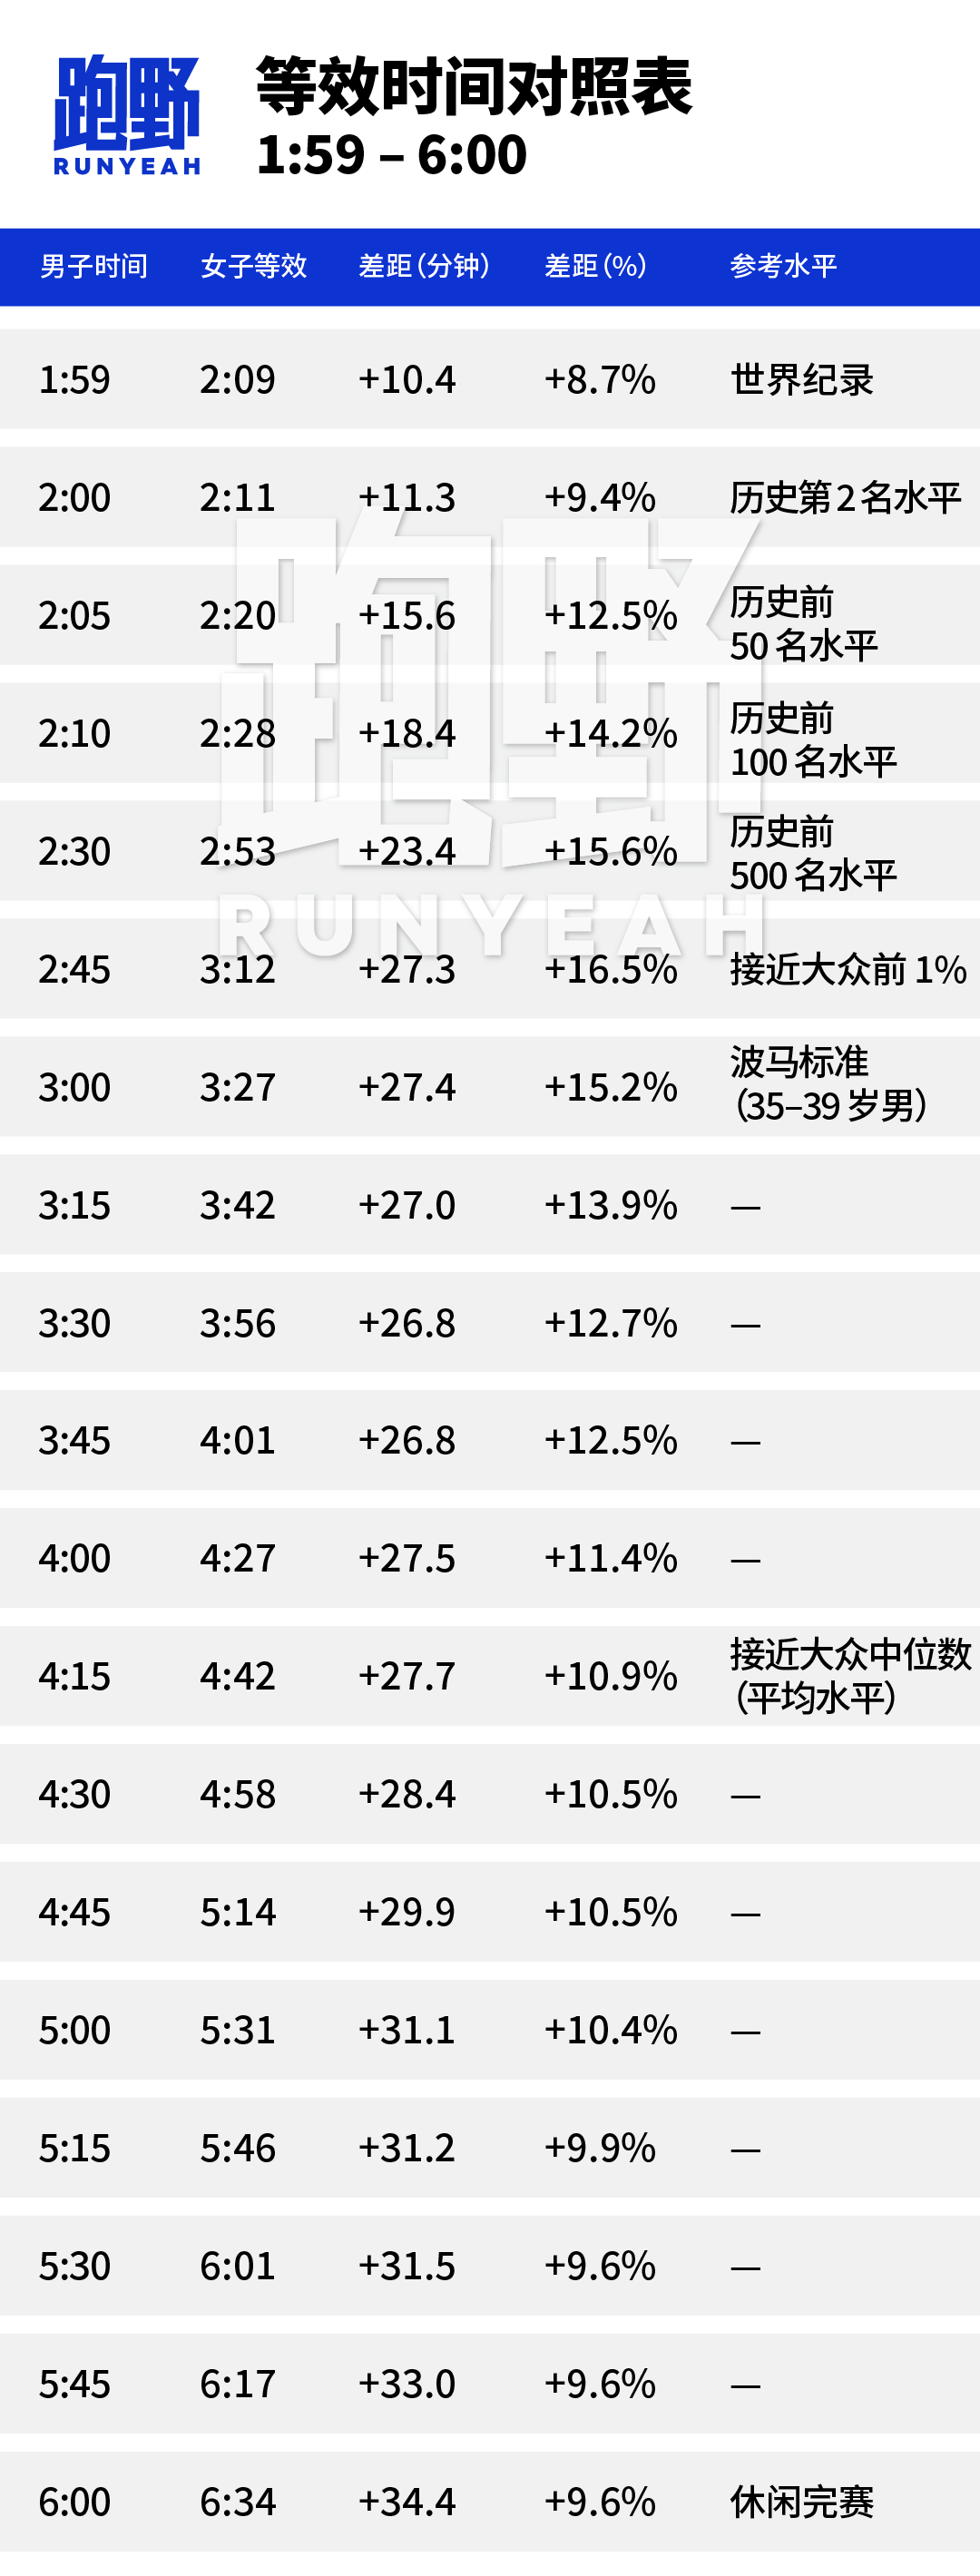
Step 1: Extract the historical top 500 results for men and women from the World Athletics database, creating 500 "ranking anchors".Step 2: From the RunRepeat database, extract male and female results at 10 percentiles (top 1%, 10%, 20% … 90%) to establish 10 "population anchors".Step 3: Sort the above 510 anchors by men's times from fastest to slowest, and use linear interpolation to fill in every minute between them.Step 4: For each men's time (to the minute), output the corresponding women's equivalent time, the absolute gap (minutes), and the relative gap (%).Using this method, a men's marathon time of 3:00 can be equivalently converted to a women's marathon time of 3:27.Compared with the long-circulated "men's 3:00 = women's 3:18", the gap reaches 9 minutes. That 9-minute difference is precisely the bias introduced by the incorrect assumption of "using the world record to represent everyone".
The table below covers men's finish times from 1:59 to 6:00, with each row corresponding to a men's time and its women's equivalent.
From the above analysis, we can draw the following key conclusions:Conclusion 1: The male-female marathon gap is not a fixed value but changes dynamically with performance level. The gap widens from 8.7% at the world-record level to 14.0% at the 500th elite, peaks at 16.6% among high-level recreational runners (top 1%), and then narrows among mass runners to about 9–11%.Conclusion 2: Using the world-record ratio to convert recreational times systematically underestimates the difficulty for women. A men's 3:00 true equivalent for women is 3:27, not 3:16 as implied by the world-record ratio. That 11-minute difference is very significant for recreational runners.Conclusion 3: The Boston qualifying standard represents very different difficulty across age groups. The BQ standard for men aged 18–34 (2:55) corresponds to roughly the top 3–5% globally, while the standard for men 55–59 (3:30) corresponds to about the top 12–15%. "The BQ cutoff ≈ top 10%" is a reasonable average approximation, but it does not apply to all age groups.Conclusion 4: Women’s relative performance in the slower finishing bands is better than in the elite band. The gender gap among the slowest 10% of recreational runners (9.6%) is even smaller than the gap at the world-record level (8.7%), suggesting that among very slow finishers, women’s endurance advantages are more fully manifested.
Image:Trail Running Big Bang/ Visual:Max