

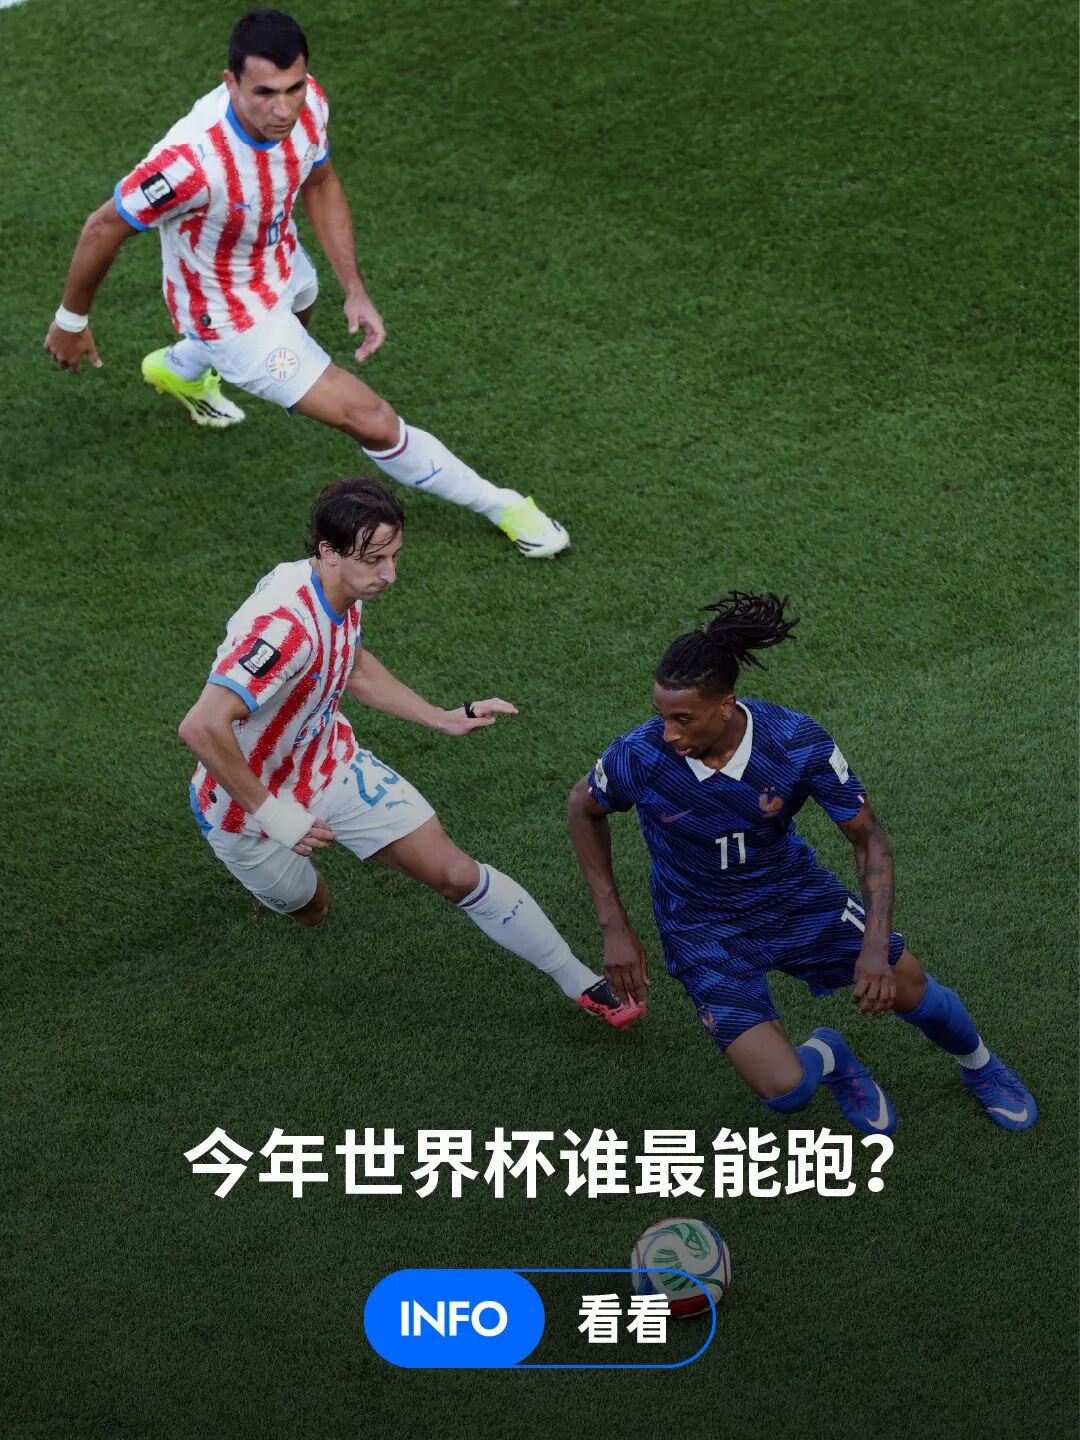
In the early hours today, the thrilling World Cup came to an end. Spain beat Argentina 1-0 to win the 2026 World Cup.
Many people who don't play football have little concept of how much distance a player covers in a single match. Even seasoned fans can only estimate a rough range; giving precise numbers is difficult.
But this World Cup,FIFA deployed player-tracking systems across all16 stadiums based on multi-camera optical tracking andAI skeleton recognition, collecting real-time position and movement data for the 22 players on the pitch. Whether it's cumulative distance, average speed, high-speed runs or sprint counts, every movement was recorded.
Today we'll start from that data to see who the most running-intensive players of this World Cup were, and what hidden stories lie behind the numbers.
01
Who ran the most?
For distance covered, we'll analyze three dimensions: cumulative distance, average distance per match, and single-match distance.
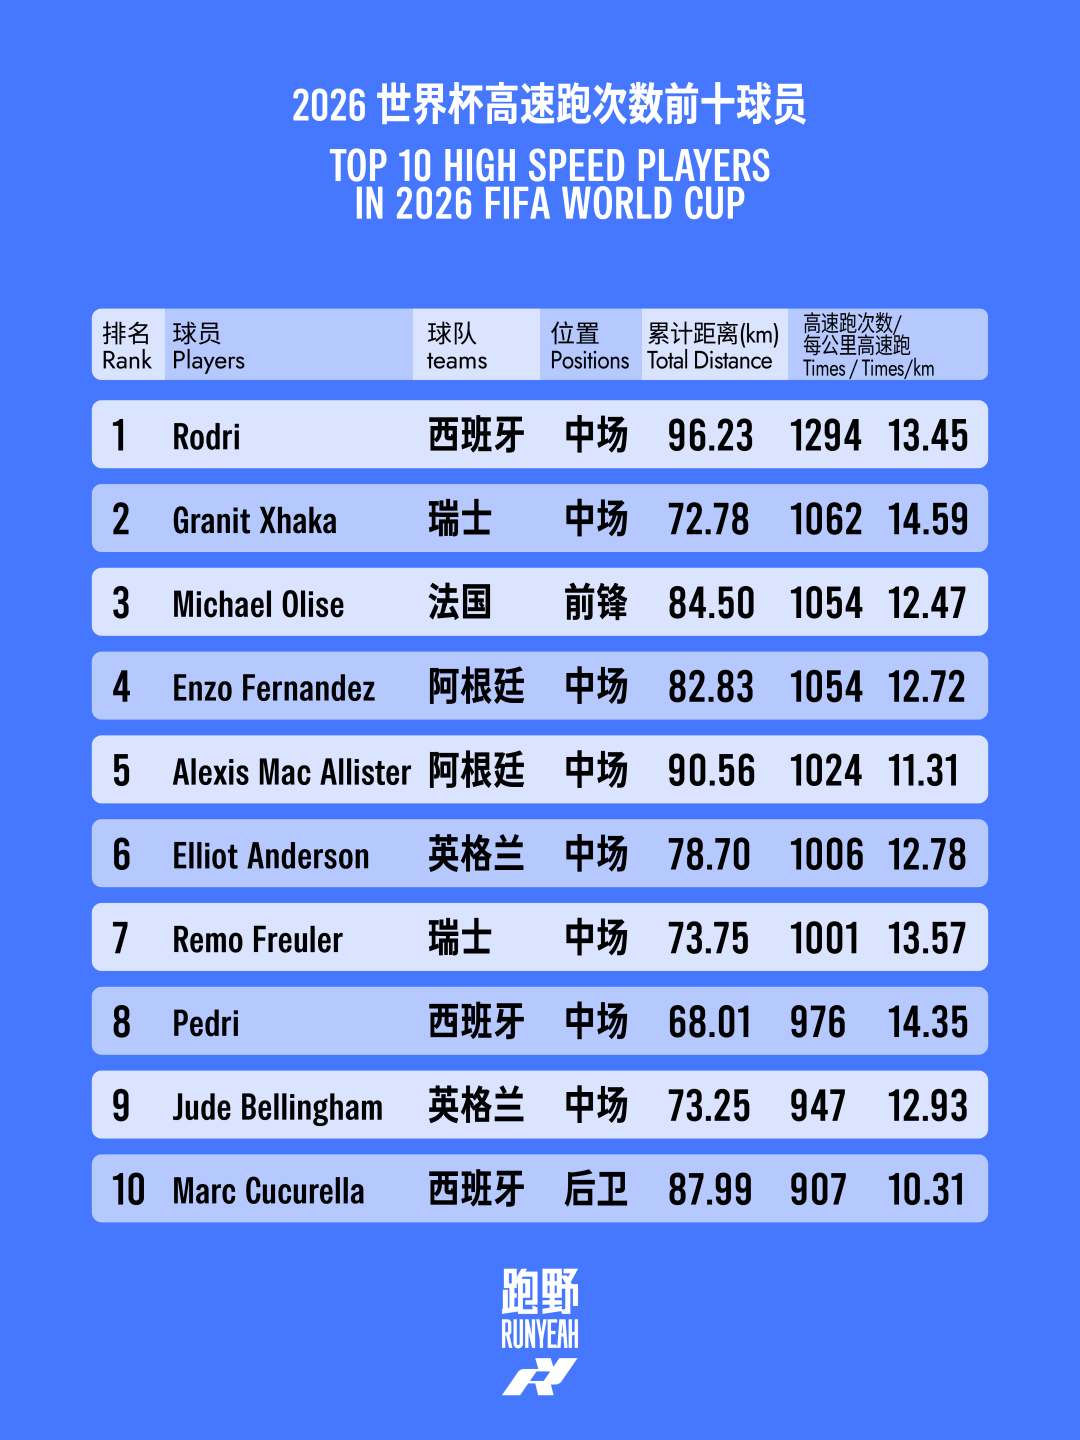
In cumulative distance, Rodri tops the chart with 96.23 km, which is more than two full marathons worth of distance. Of course, he didn't run that in one go; it was accumulated over Spain's eight matches. The top ten overall list includes five midfielders, three defenders and two forwards. Spain and Argentina together account for six players in the top ten.
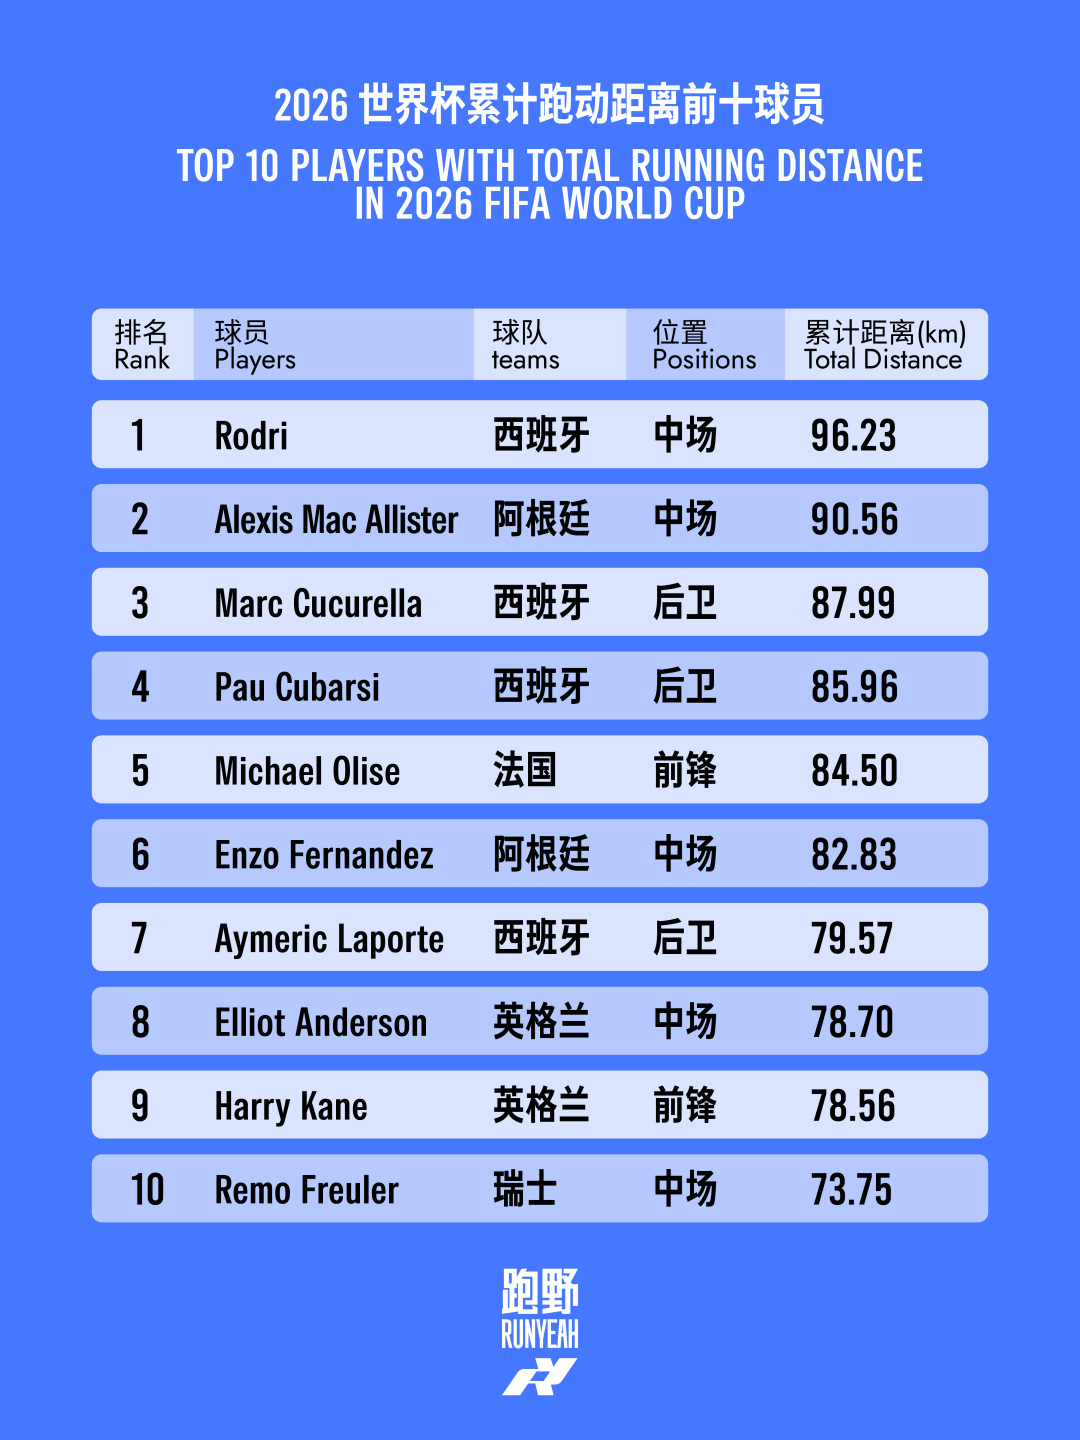
Cumulative distance not only reflects fitness but is also affected by how far a team progresses, a player's selection consistency, and whether they often play full matches. Midfielders need to continuously link defense and attack; defenders usually have relatively stable tactical roles and, barring injury or suspension, often play full matches. Forwards and wingers are more frequently substituted for tactical or energy management reasons. Plus, teams like Spain and France that reached the semifinals and beyond naturally gave their key players more time to accumulate distance.
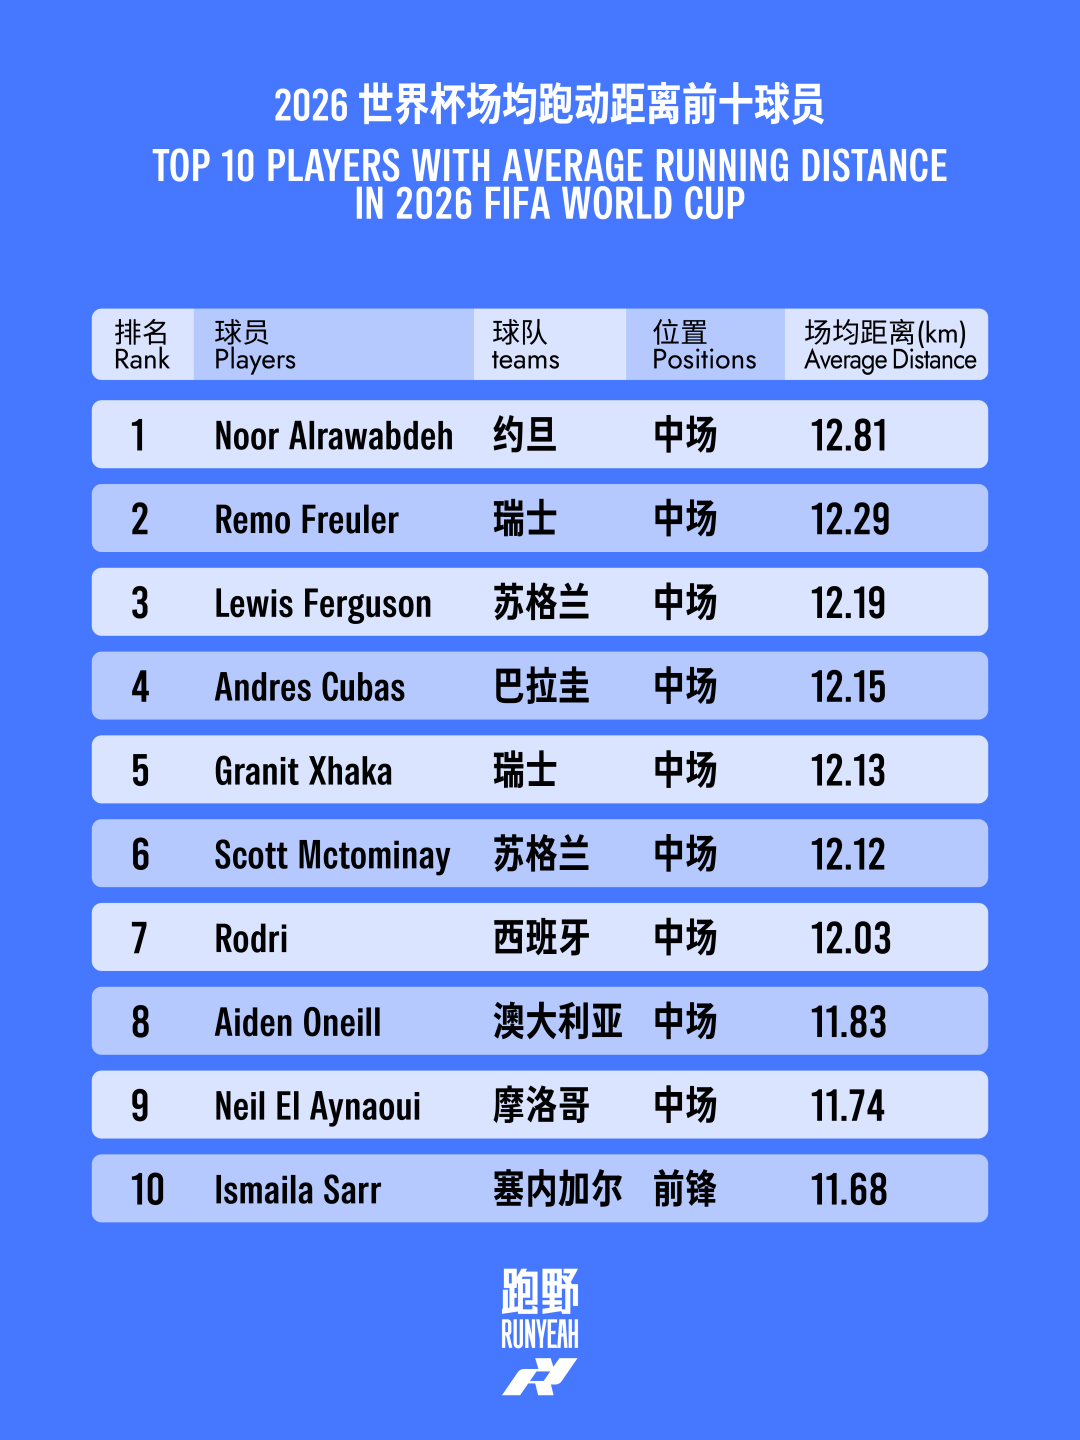
Look at average distance per match, and the story changes. Nour Alawad ranked first with an average of 12.81 km per match. Nine of the top ten in average distance are midfielders, with only one forward, Ismaïla Sarr. That makes sense: midfield is the area with the largest activity range on the pitch. Midfielders must drop back to receive the ball, push forward to join attacks, press immediately after losing possession, and recover quickly when the opponent breaks the first line. When matches involve rapid transitions they are usually the busiest group.
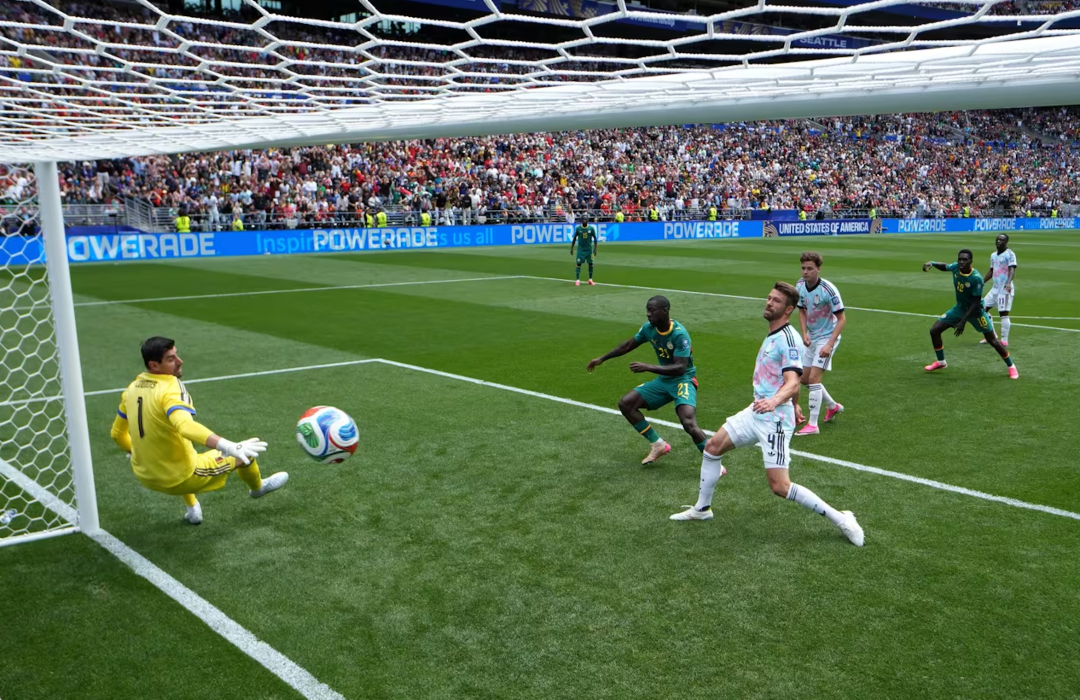
For single-match records, things change again. Belgium defender Castagne ran16.29 km in Belgium's 3-2 win over Senegal, which FIFA listed as the highest single-match distance of the tournament — but that game went to extra time and was a more than120 minute battle. By contrast, Rodri ran12.63 km in Spain's 2-0 semifinal win over France — a less eye-catching absolute number but achieved within the standard90 minutes. If Castagne's figure is converted to a 90-minute basis, it comes to roughly12.22 km.
Therefore, total distance, average per match and single-match distance each reflect different phenomena and questions: total distance shows who carried the heaviest workload across the whole World Cup; average per match shows which players and positions need to maintain high coverage in every game; and single-match distance shows who endured the highest load in a particular match.
02
Who was the fastest?
Opening the top speeds list gives you a fresh perspective.
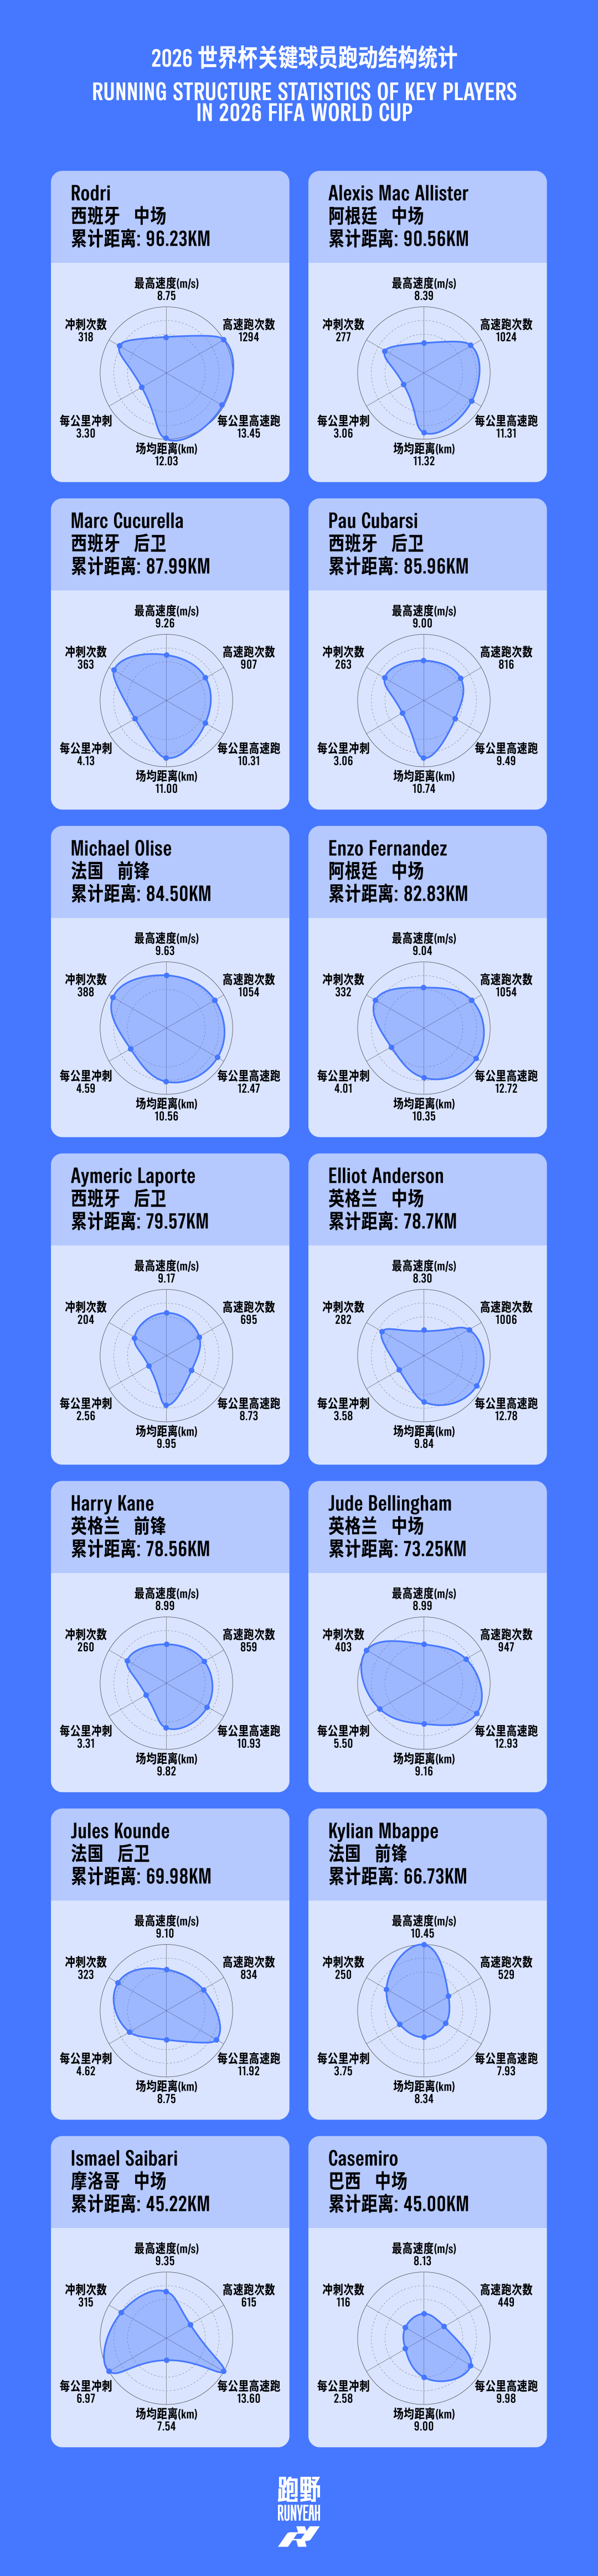
Mbappé ranks first with 10.45 m/s.Six of the top ten highest speeds are defenders and four are forwards; no midfielders made the top speed list. It's almost the inverse of the cumulative distance leaderboard: the cumulative list favors midfielders, while the top speed list is dominated by forwards and defenders.
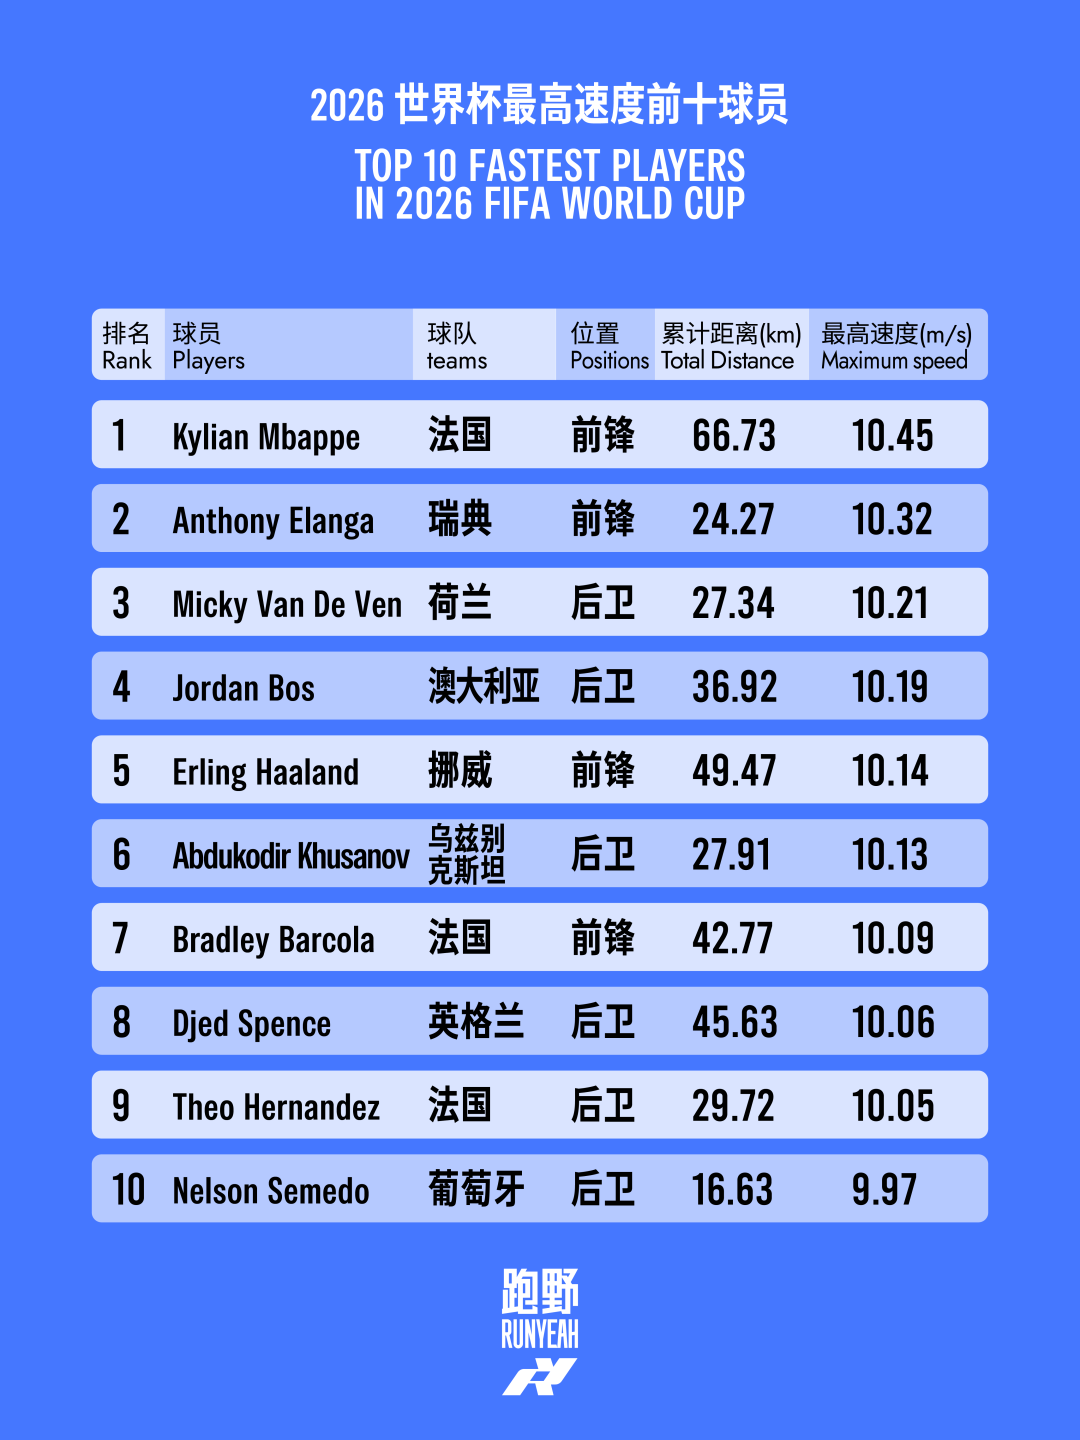
Forwards more often reach long sprinting distances when counter-attacking, chasing through balls and exploiting space behind defenses; full-backs need to overlap and recover at high speed; central defenders may be forced into all-out chases during defensive transitions. Midfielders, while covering a large total distance, accumulate much of it through receiving, lateral movement and continuous coverage rather than frequently hitting top speeds.
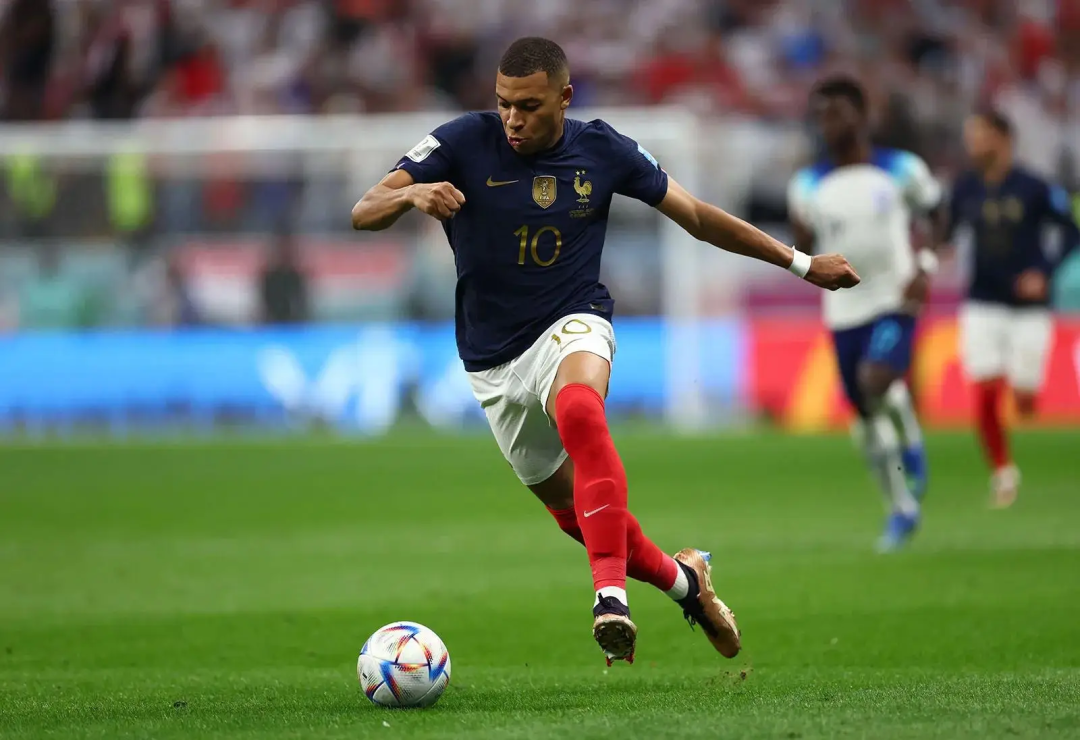
The contrast between Mbappé and Rodri is the most direct.Mbappé accumulated 66.73 km and reached a top speed of 10.45 m/s ; Rodri accumulated 96.23 km with a top speed of 8.75 m/s. The former reflects explosive, instantaneous output, the latter sustained coverage.
Of course, some players can maintain high speeds even with large running volumes. Olise totaled 84.50 km (ranked fifth) and still reached a top speed of 9.63 m/s; Cucurella logged 87.99 km with a top speed of 9.26 m/s.
03
Whose tactics were the most aggressive?
High-speed runs and sprints represent how many times a player moved at high intensity, and can to some extent reveal tactical intent and running structure.
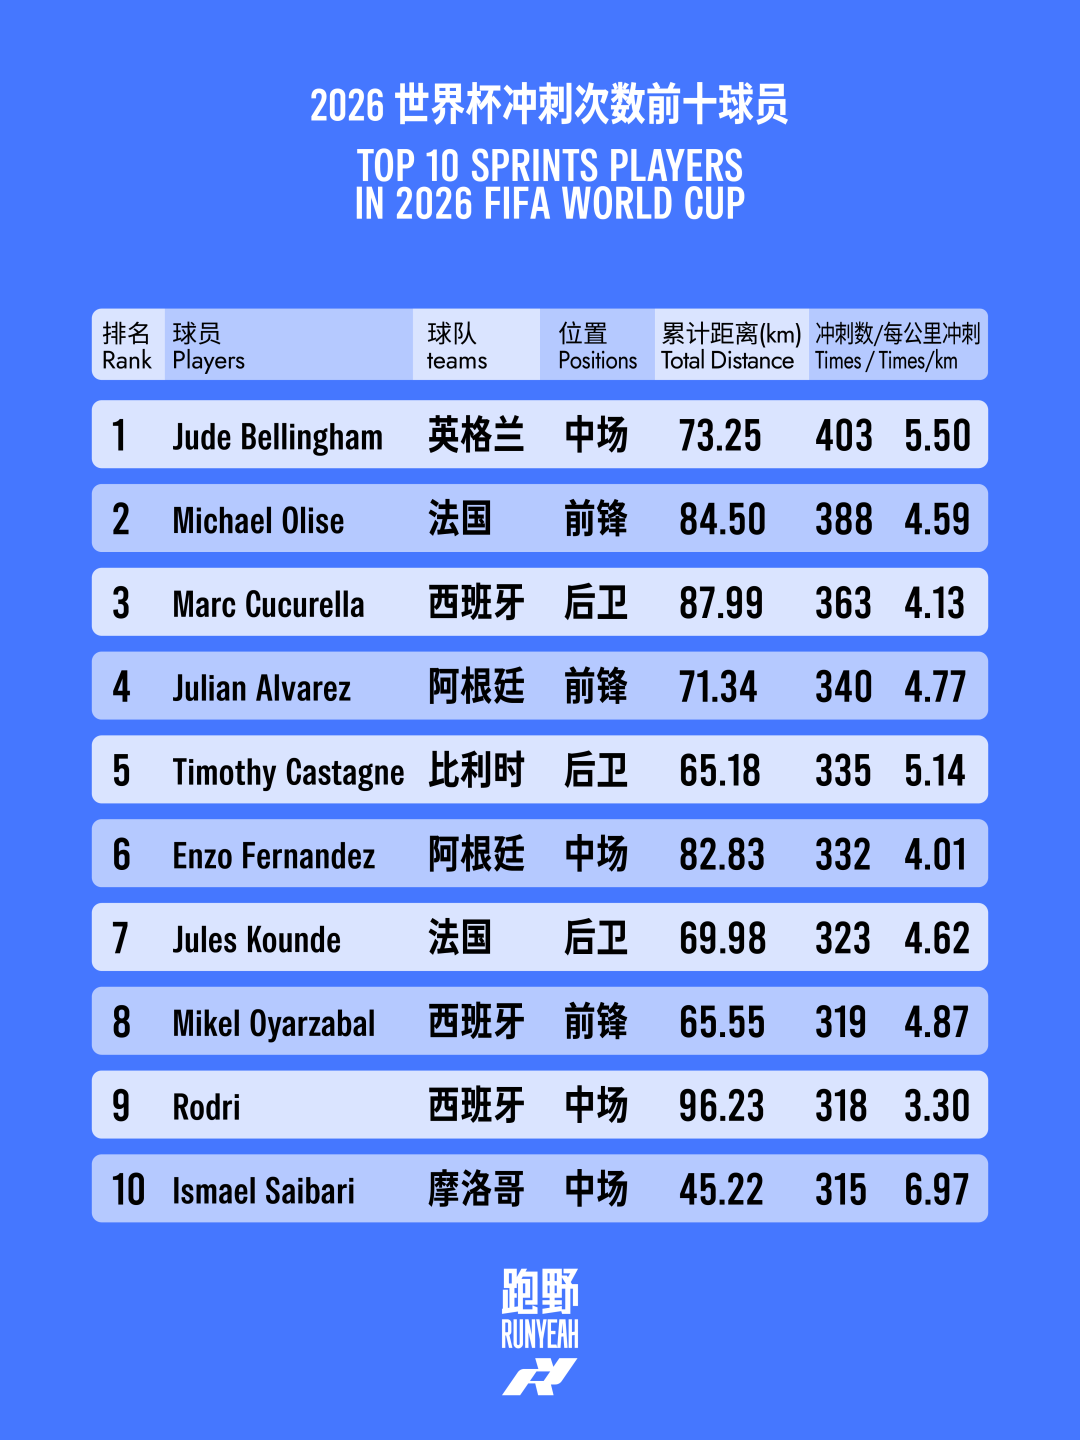
Bellingham tops the sprint count with 403 sprints, Olise follows with 388, and Cucurella ranks third with 363. Among the top ten there are four midfielders, three forwards and three defenders, which shows sprints are not exclusive to forwards: midfielders' forward runs and recoveries, and full-backs' up-and-down play also generate many high-intensity starts.
But a high total sprint count doesn't mean the most frequent sprints per unit distance. Bellingham averages 5.50 sprints per kilometer; Oliseaverages 4.59 sprints per kilometer. Sejbari, despite a total distance of only 45.22 km, completed 315 sprints — 6.97 sprints per kilometer. Rodri, though he ran 96.23 km, averaged just 3.30 sprints per kilometer.
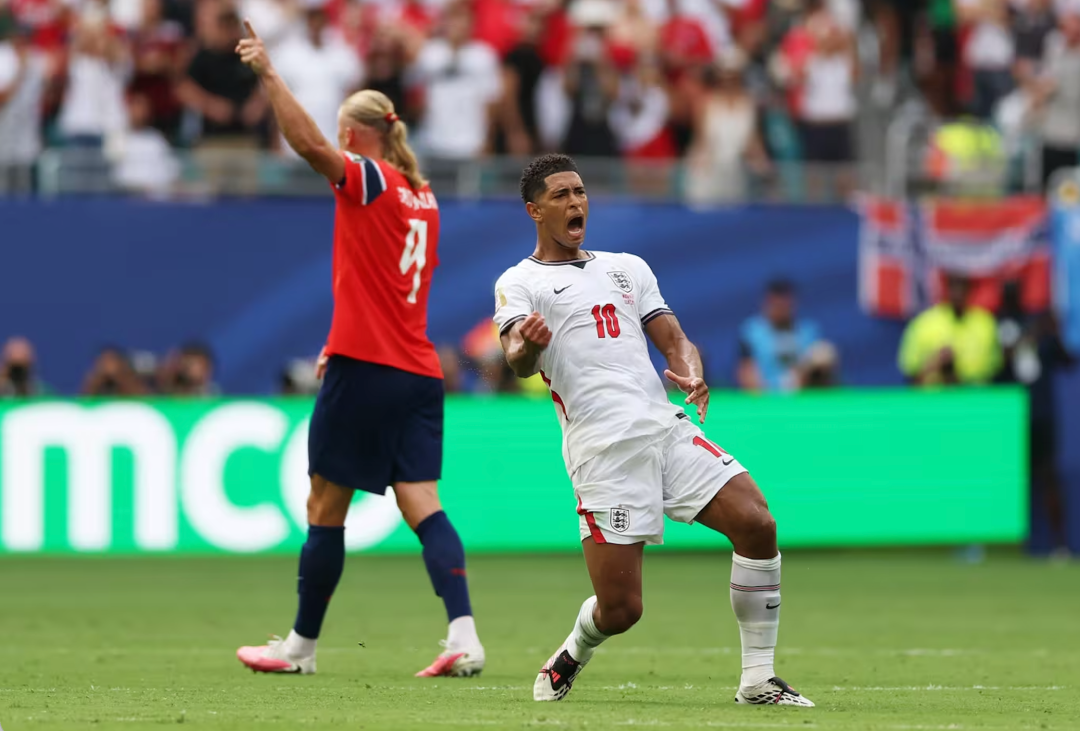
These four players represent different strategic profiles: Bellingham and Olise combine high totals with high density; Sejbari focuses on repeated vertical bursts per distance; Rodri emphasizes continuous support, lateral coverage and maintaining possession structure.
From multiple dimensions, Olise and Bellingham stand out as typical "all-round" players in this tournament. Olise totaled 84.50 km, completed 1,054 high-speed runs and 388 sprints, reaching a top speed of 9.63 m/s; Bellingham totaled 73.25 km, with 947 high-speed runs and a leading 403 sprints. They may not top every single metric, but maintaining volume, high-intensity counts and speed together represents a more complete running value.
04
Different roles, different running styles
The most obvious trait of midfielders is their wide coverage. Nine of the top ten in average distance per match are midfielders, and eight of the top ten in high-speed run counts are midfielders. They must provide passing options for defenders, support the front line, and quickly switch to pressing or recovery after losing possession. Thus midfielders' strength lies more in sustained running and repeated involvement than in hitting the highest single-occasion top speeds.
Defenders occupy six spots on the top speed list because full-backs repeatedly overlap and recover, and center-backs facing quick counter-attacks must sprint across large spaces. High top speed for defenders doesn't mean they spend the whole match at high speed, but that in certain defensive scenarios they need to hit very high velocities.
Forwards are less represented on cumulative and average-distance lists but appear more on top speed and sprint lists. Their running is concentrated on explosive starts, attacking the defensive line, exploiting space behind defenses and positioning inside the box. Midfielders act as a continuous engine; forwards are the attack points that accelerate suddenly at key moments.
The sprint-count leaderboard is the most balanced composition: four midfielders, three forwards and three defenders. That shows high-intensity movements in modern football are no longer the domain of a single position. Forwards sprint to attack, full-backs shuttle up and down, midfielders make forward runs and recoveries; the same sprint can serve completely different tactical purposes.
Distance, speed, high-speed runs and sprint counts are just the final numbers on display; football has never been a simple arithmetic problem. Running less doesn't necessarily mean less commitment, and running more doesn't automatically mean greater efficiency. What truly matters is the tactical responsibilities behind these numbers — whether players used their fitness and strengths at the right moments to create space, possession and advantage for their teams.
[End-of-article interaction]
# Which player was your best player of this World Cup?#
Text / Editor: JOJO
Image sources: Internet
Visuals: Max