(Chamonix, France, April 27, 2026) With the rapid growth of trail running, the global trail-racing circuit UTMB World Series has announced a UTMB INDEX(UTMB Performance Index) has announced a major upgrade.
The update was driven by a working group of ten trail running experts and professional athletes, and was accompanied by a recalculation of results from the past five years.
In the world of trail running, finish time is often the most misleading metric. To help runners better understand UTMB Index the calculation logic and their own performances, we'll use two CCC winning results to see how the new-generation UTMB Index system can produce such close and relatively fair scores under large environmental fluctuations?
The answer is hidden in the UTMB Index's four-step algorithmic logic that resembles a 'black box'.
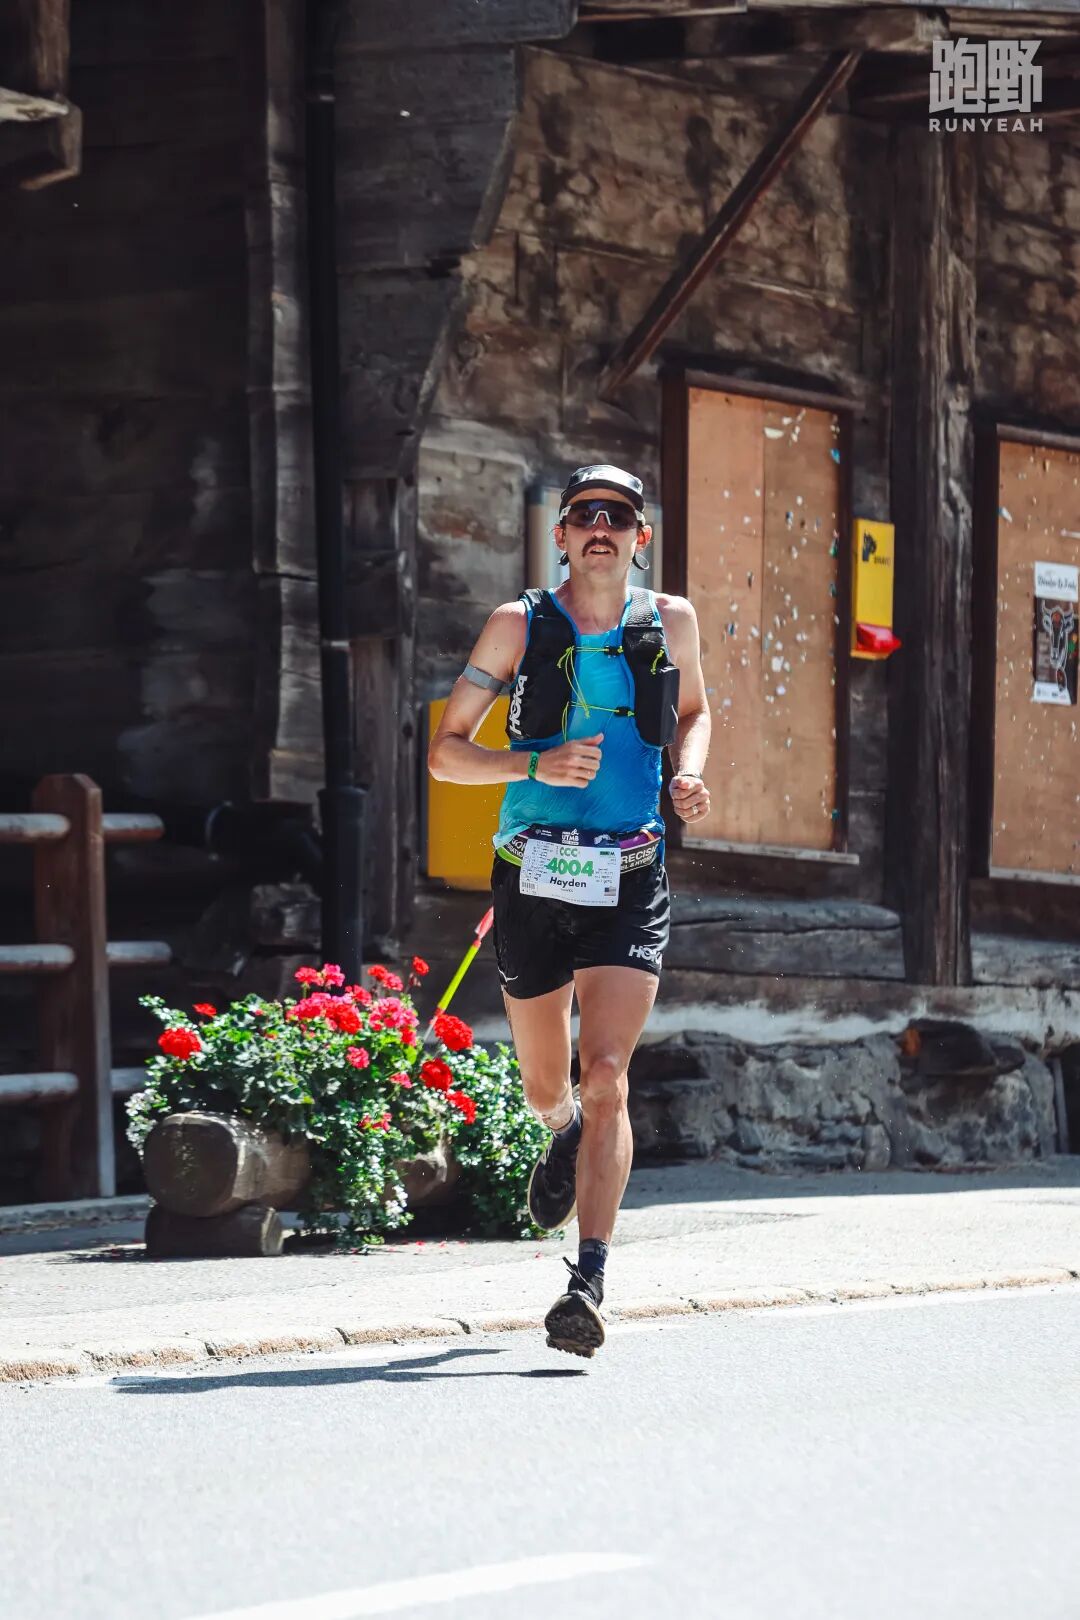
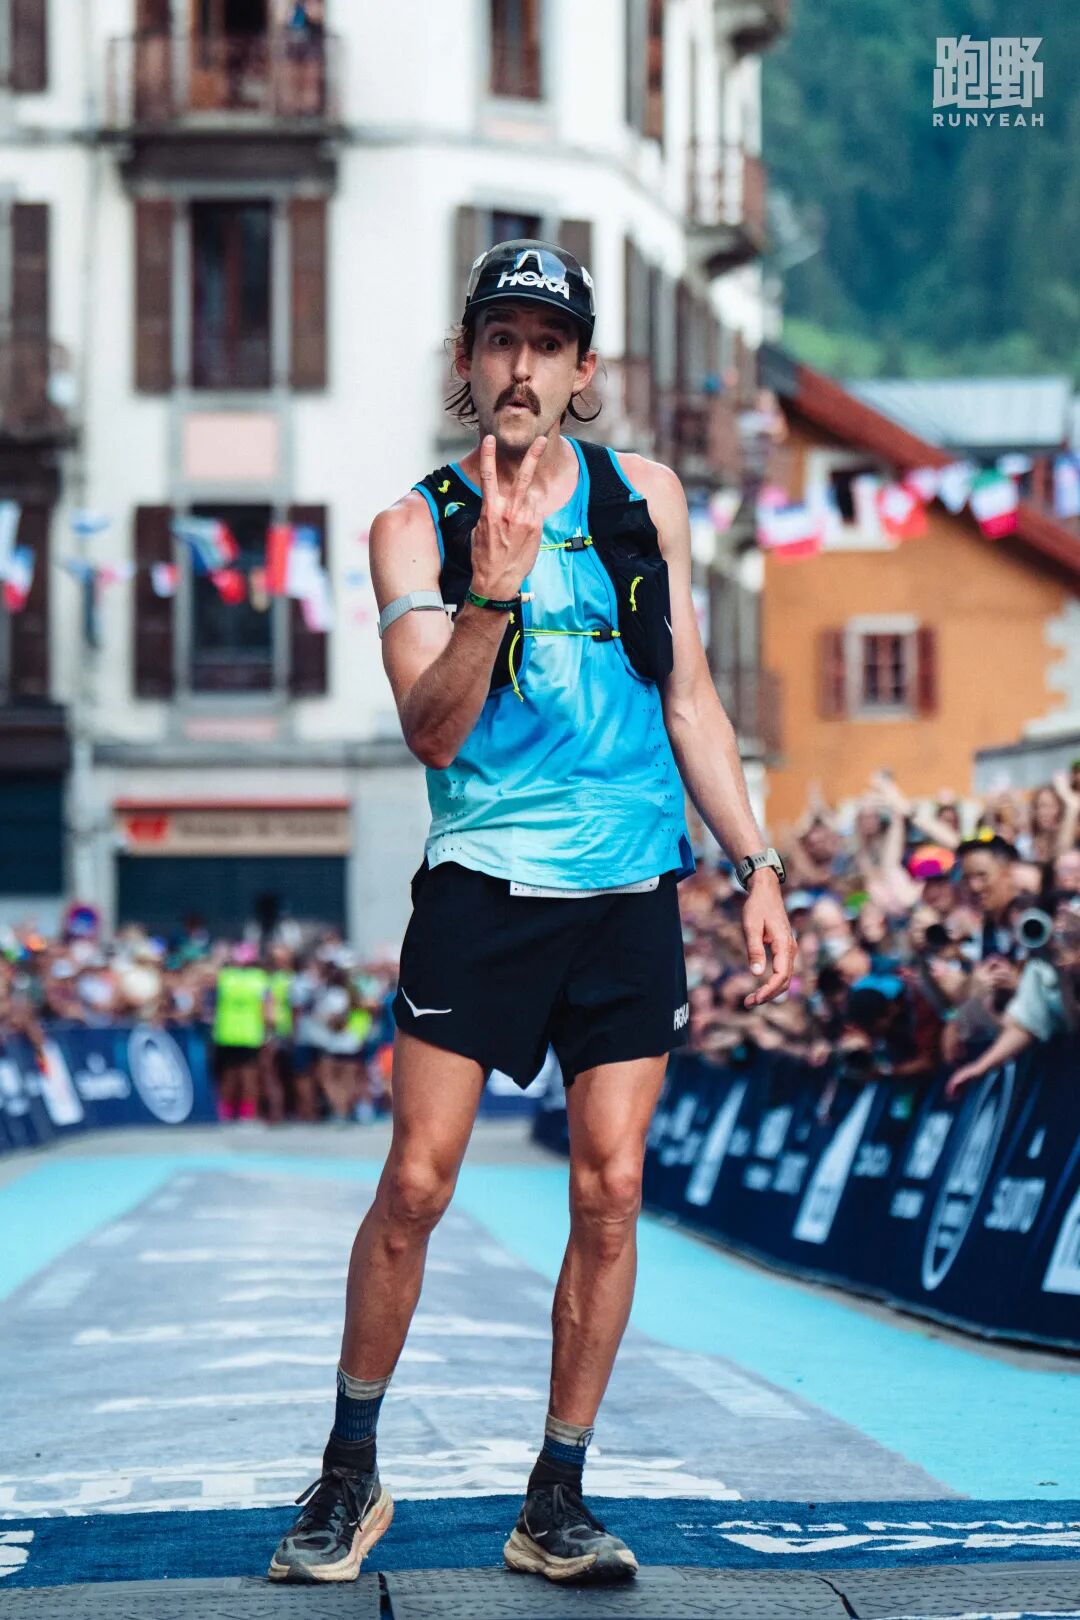
In 2022 Petter Engdahl won with a time of 9 hours 53 minutes and in 2024 Hayden Hawks won with 10 hours 20 minutes; ultimately Petter Engdahl scored 968 points, while 27 minutes slower Hayden Hawks scored 961 points — only a 7-point difference.
Why Petter Engdahl and Hayden Hawks received almost the same credit despite a 27-minute time gap. To understand why, we must first recognizewhy finishing times can't be compared directly: because trail running courses change every year.The CCC editions in 2022 and 2024 revealed completely different competitive realities. 2022 was the fastest edition in the past five years, with temperatures holding between 6–14°C—ideal for fast times—and its DNF (Did Not Finish) rate was only 18%. In 2024, runners faced valley temperatures of 30°C and the DNF rate surged to 28%, meaning one in four competitors failed to finish.In addition, the 2024 course abandoned the relatively gentle Tête aux Vents in the final section and instead chose the more technical, downhill-tormenting Béchar route. Even if the Effort-Kilometer (KME) literally remains the same, KME cannot capture the subtle differences in muscle wear and technical difficulty.“Weather changes everything. In long-distance events, heat redistributes the balance: hydration, thermoregulation and accelerated muscle fatigue — finish times will directly feel this strain.” To remove this noise, the algorithm doesn't use absolute speed but absorbs variables through "coefficients". Notably, the system excludes all DNF data during calibration, using only finishers' performances to anchor the day's difficulty.In the algorithm's first step of "finding similar races," the model displays an interesting "information asymmetry." To assess course difficulty, the system selects reference points from a database of 30,000 races. Its core metrics are two: distance and elevation density. But when using runners' historical data, the model follows a "downward compatibility" principle: an athlete who can finish 100 km provides a valid reference for 50 km events; conversely, a 50 km runner's history cannot accurately predict their potential in a 100 km mountain race.For example, when computing the CCC reference frame, "twin races" like UT4M (very similar in distance and elevation density) carry a high weight; more distant relatives, such as the "Fools' Duel (Diagonale des Fous)" — longer and much rougher — are included but their signal is flagged as "noisy" and their weight is lowered.From this we can also understand why, under the new UTMB Index, the top-scoring Chinese women's trail runner shifted from Yao Miao (822 points), who has focused on short-distance events in recent years, to Xiang Fuzhao (825 points), who specializes in 100 km and 100-mile races.After reference events are selected, the system calculates an expected score and a Stability Index for each participant. This is a confidence interval ranging from 0 to 1.The system applies a nonlinear function to amplify contrasts: high-quality raw data are pushed toward 1, while raw scores that lack historical data or show volatile performances are pushed toward 0. By enhancing contrast this way, the model ensures the final regression analysis is built on the most reliable runners.Hayden Hawks (0.884): Although he has never raced CCC, the algorithm considers him highly reliable thanks to his remarkable consistency in races like Western States 100.Dakota Jones (0.888):has a 2023 CCC race record, which in the algorithm counts as the "strongest reward anchor" and has the highest stability.Arnaud Bonin (0.184):Although ranked 10th, he previously lacked historical records at the 100km level, so his data was regarded as "high noise." But after completing this race, his 886 points will become a "direct signal" for his subsequent races, thereby increasing his future stability index.These trust scores will be used as weights to determine each athlete's say when establishing the overall race "coefficient".In the 2024 CCC race, 648 runners finished within twice the winner's time, which was 20 hours 40 minutes 22 seconds. The system will construct from these runners a Regression Pool of 102 people (Regression Pool). The pool is composed of 80% "elite runners" (reflecting the race-day front-line competitive form) and 20% "stable runners" (historically highly predictive benchmarks).The 80% elite group are the fastest finishers — the top 82 — while the 20% stable runners represent the 20 "anchor runners" whose historical performances are the most predictable and reliable.During calibration, the system uses asymmetric regression. This means the algorithm is extremely strict toward "exceptional performances" while relatively lenient toward "off performances". Taking the 2024 CCC as an example, the algorithm adjusts across three key dimensions:1. Grade: an elevation gain of 122 m per km makes the model scrutinize exceptional performances more harshly, because technical courses are more prone to randomness.2. Altitude: summits above 2,500 m make the model favor elite runners, because they typically have better high-altitude adaptation; unexpected breakthroughs by amateur runners are treated with caution.3. Competitiveness: a high competitiveness index of 0.69 slightly relaxes restrictions on top athletes, since fierce clashes among elites are more likely to produce genuinely breakthrough performances.From now on, 1000 points is no longer an insurmountable ceiling, but a specific time threshold determined by the coefficient calculated for each race. In the 2024 CCC event, after optimizing the regression pool, the system's final coefficient was 98.3 pts/km/h. This means:2022 (the faster edition): a time of 9 hours 34 minutes was required to reach 1000 points.2024 (the tougher edition): a time of just 9 hours 56 minutes was enough to earn 1,000 points.This demonstrates the algorithm's central error-compensation principle: even if the official measurements of distance or elevation are imprecise (for example, 103 km being misreported as 101 km), as long as the field's relative rankings and speed tiers are determined, the computed coefficient will automatically offset those geographic discrepancies, ensuring absolute fairness when comparing scores across races.More precisely, the UTMB Index system isn't designed merely to grade performances; it was created so that the uniqueness of each race can be respected,Each race's coefficient is 'voted' into being by that day, that group of runners, and that particular weather. The score a runner receives is more than just a placing and a number; it serves as a dynamic ruler. It not only measures how fast the runner ran, but also how much they overcame forces beyond their control.
Text: Trail Running / Editor:David